2016
Data Visualisation, Web design
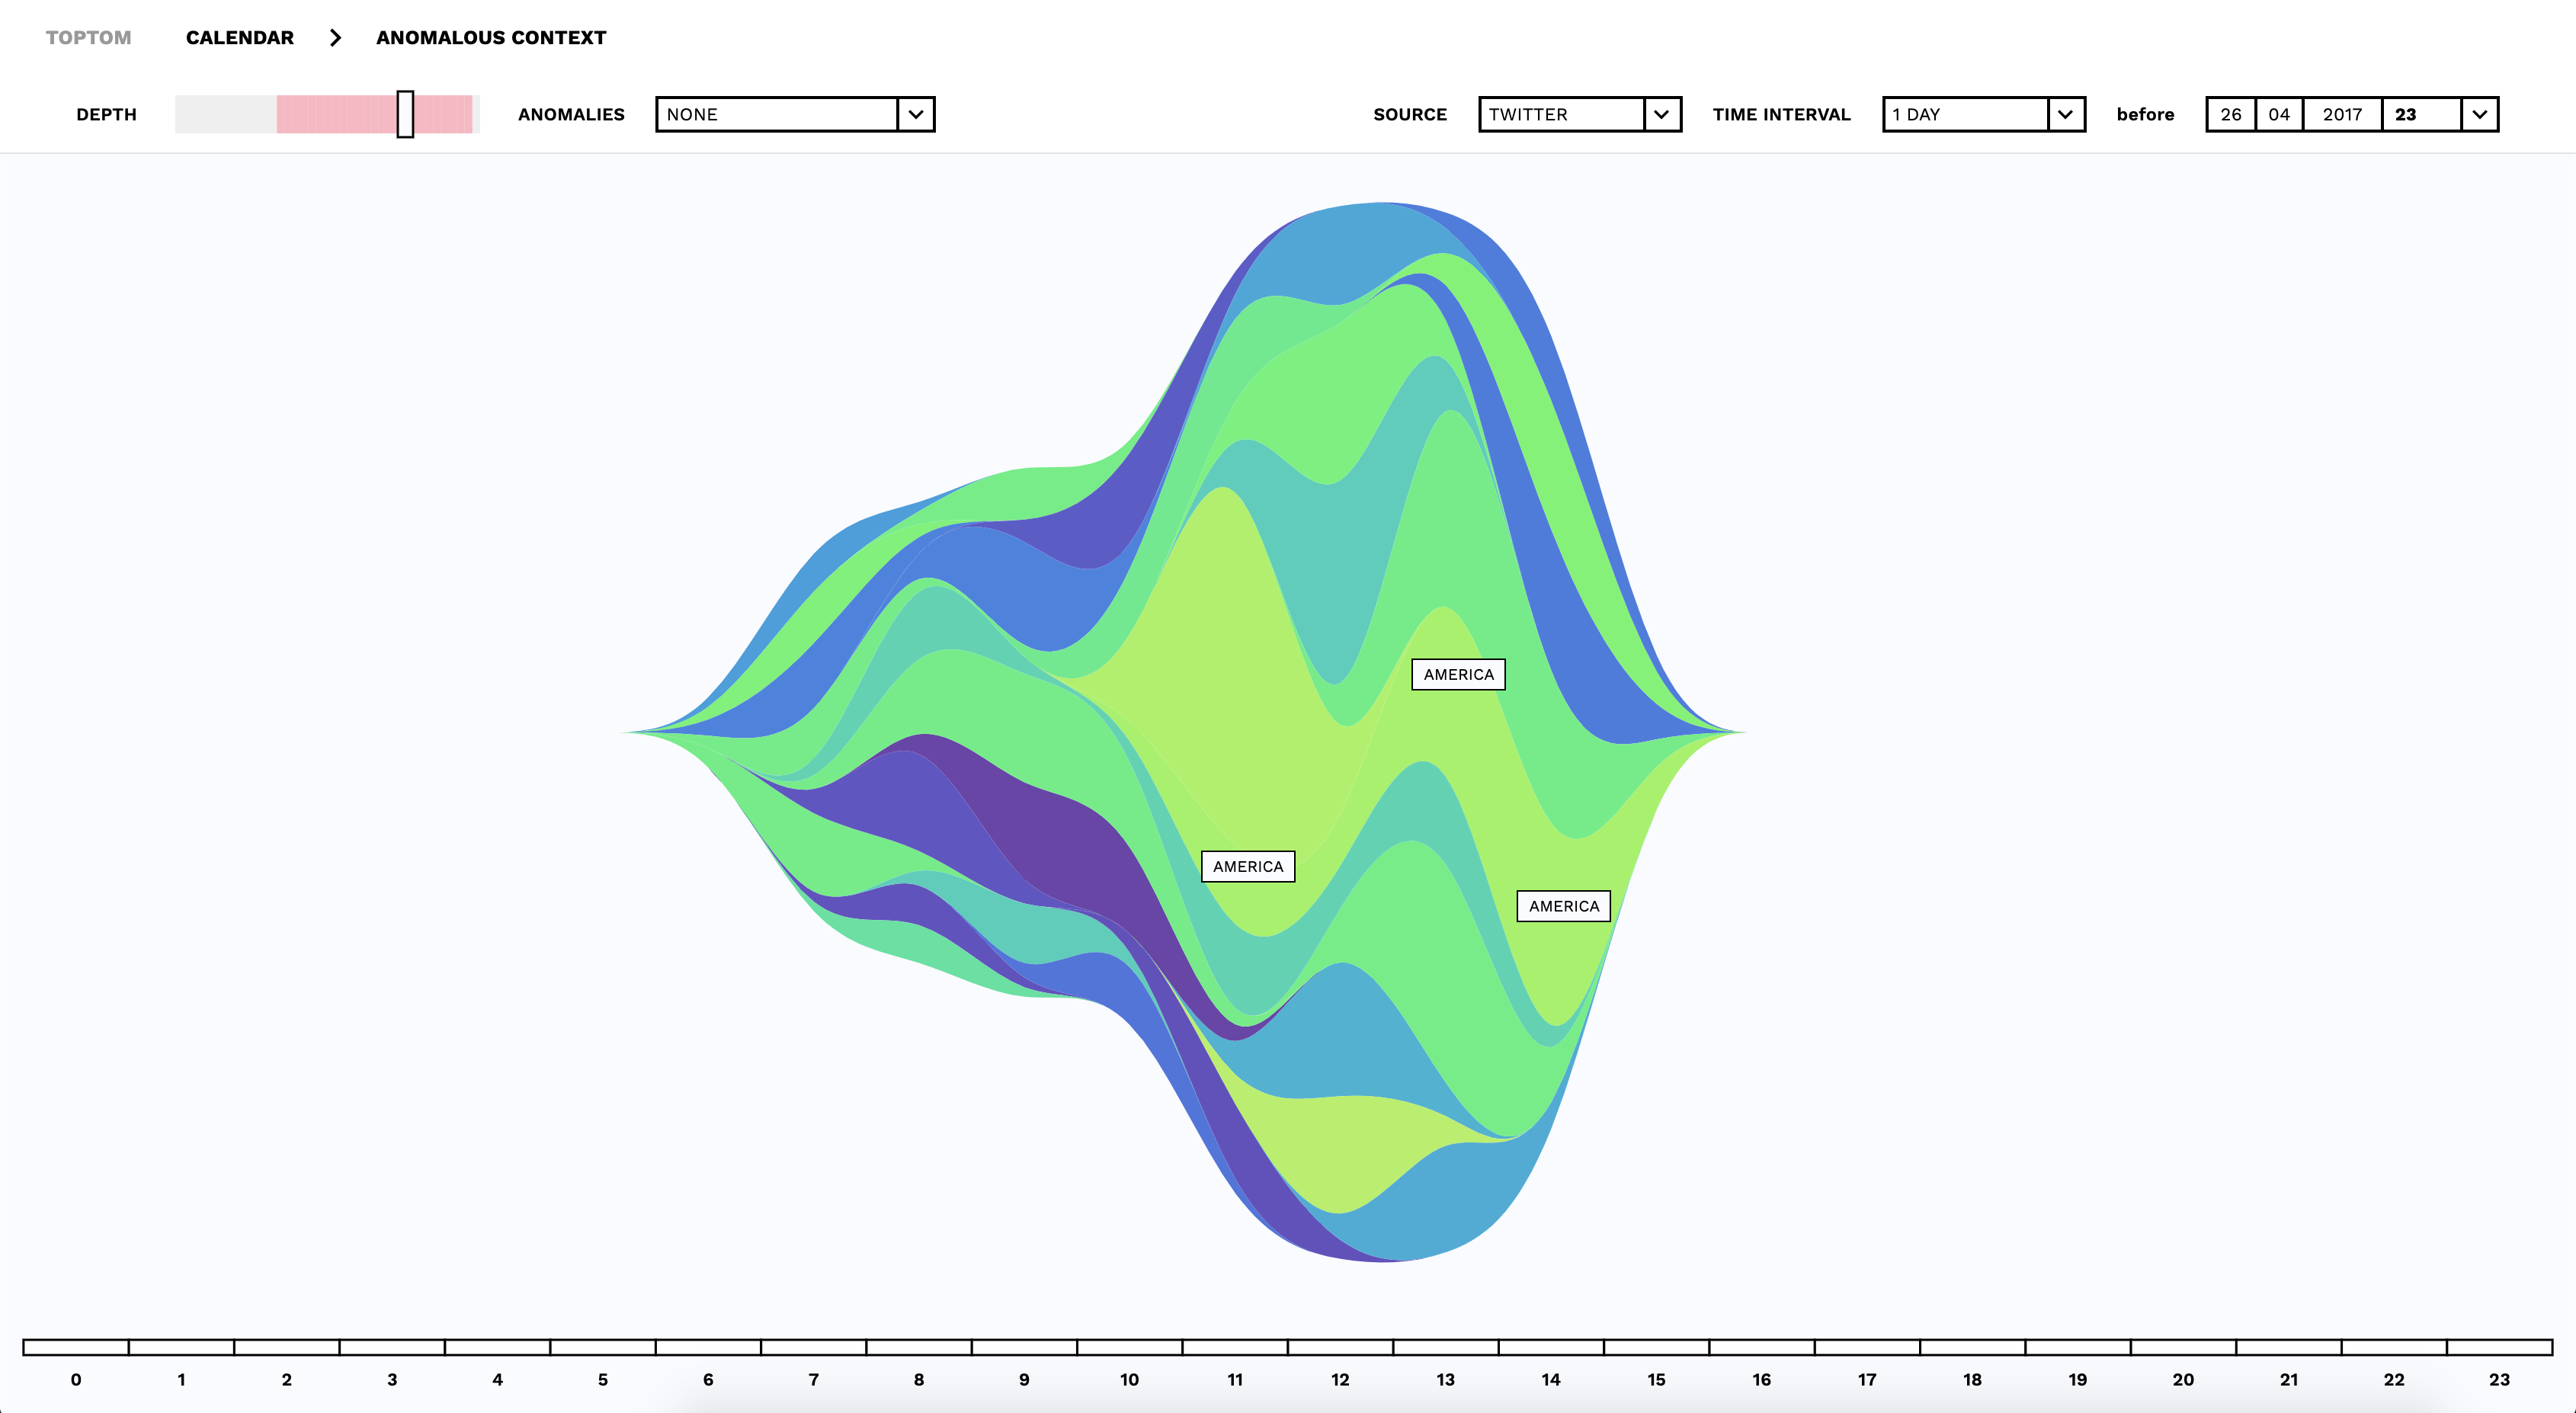
The project is a collaboration between DensityDesign Lab and ISI Foundation. ISI Foundation is a private Foundation conducting research in the area of Complex Systems Science. In the information overload age, the user needs to find specific information without reading huge collection of documents. Topic modeling is a statistical model based on supervised and unsupervised algorithms that allow the identification of topics – defined through a group of words – from a large collection of documents. TopTom (Topic Tomographies) is a research project on topic modeling visualization about the increasing use, abuse, and diffusion of opioids in the USA based on a stream of data from Twitter, Reddit and Gdelt. The aim of the project is to design a web tool that facilitates the monitoring of this topic. TopTom is a tool addressed to domain experts and analysts who need to monitor the trend of specific topics along time, looking at perturbation or anomalies. Is a near-realtime sensor for profiling phenomena. Therefore, being the user an office worker, the tool is a desktop-based application.
Team
- Michele Mauri
- Duilio Balsamo
- Paolo Bajardi
- Andre Panisson
- Paolo Ciuccarelli
- Riccardo Scalco
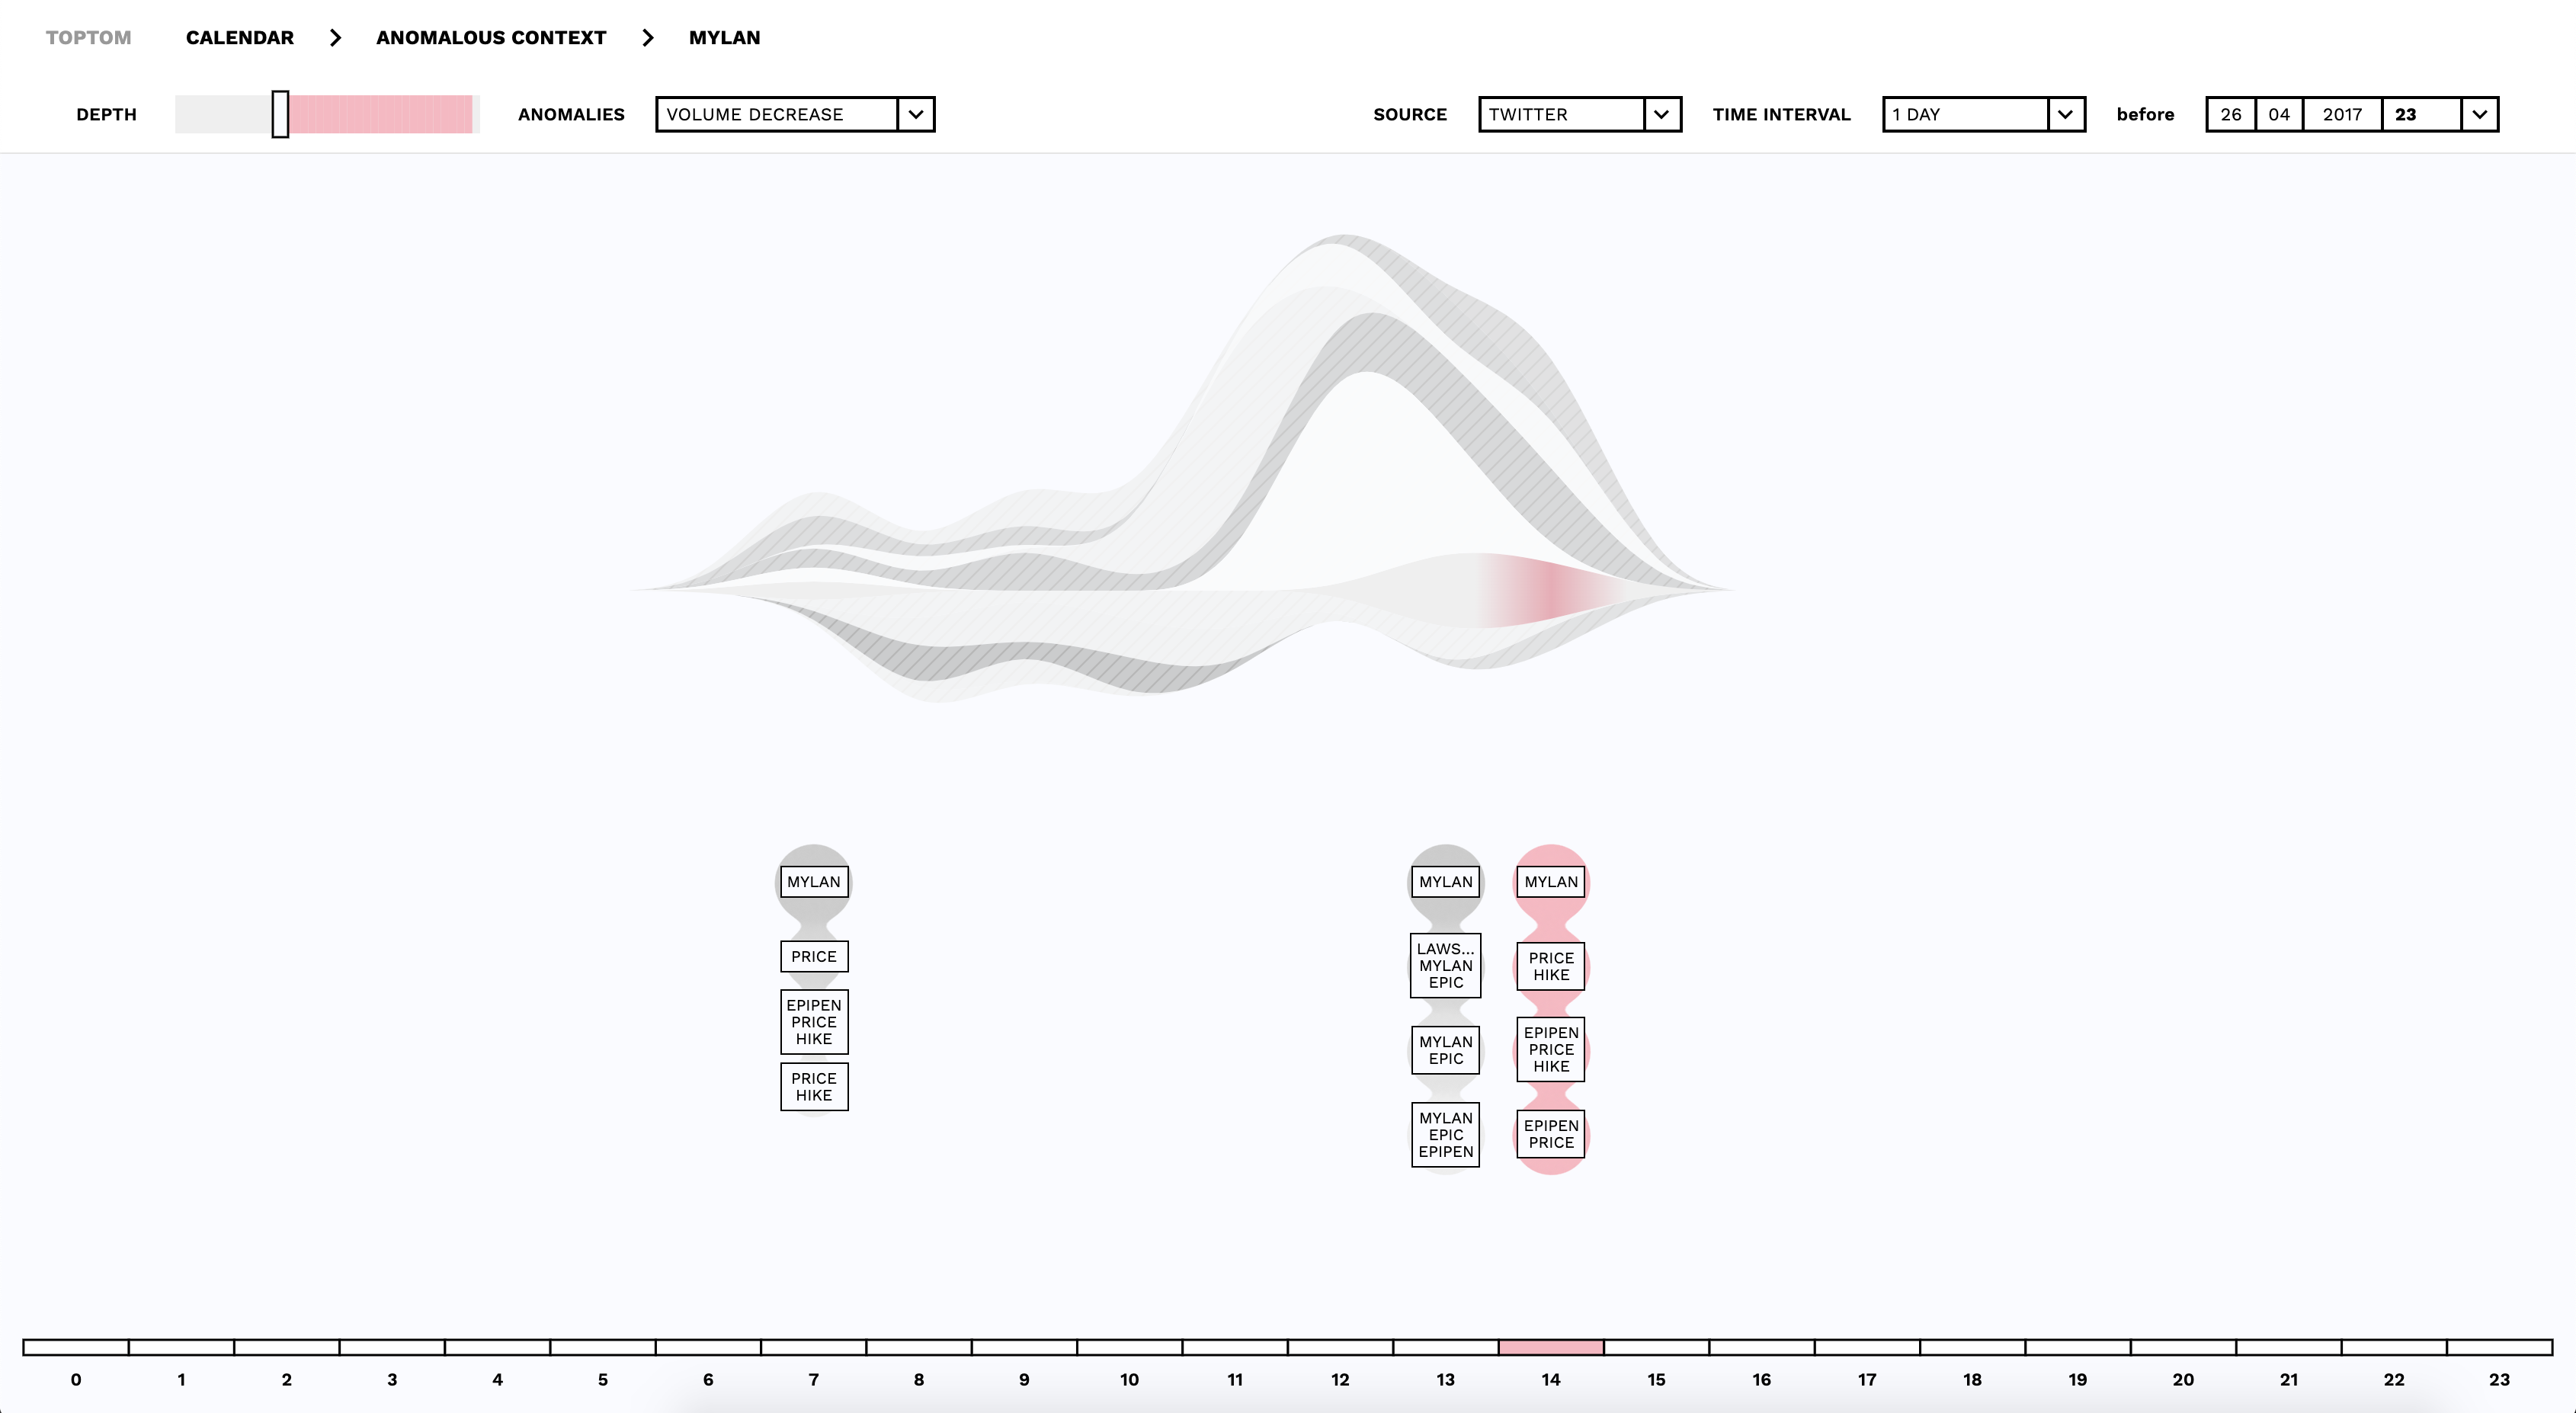
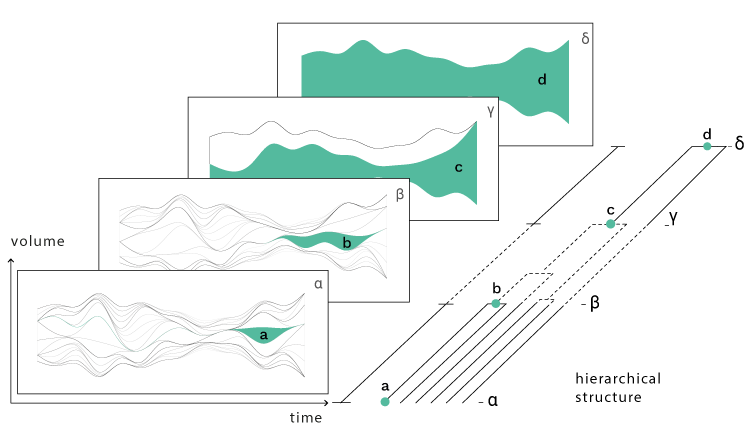
Always addressing an expert and niche audience, the visualization of the results of topic modeling has always been linked to visual models sedimented and known as streamgraphs, word clouds and force directed graphs. During the initial research phase of this project, it emerged that a metaphorical approach to data complexity can facilitate its representation and usability through a simple and intuitive interface. According to users’ needs, the interface is structured on three different views organically linked and based on the idea of micro/macro readings. For this reason we designed a system based on three main visual metaphors: the flowing of molecules, the anatomical section like in tomographies, and the contrast analysis in organisms.